01 / THREE DIFFERENT LABELS
Proximity, score share, and percentile are not interchangeable
A percentage sign does not tell you what a score means. Read the words around it and identify the calculation before comparing it with anyone else.
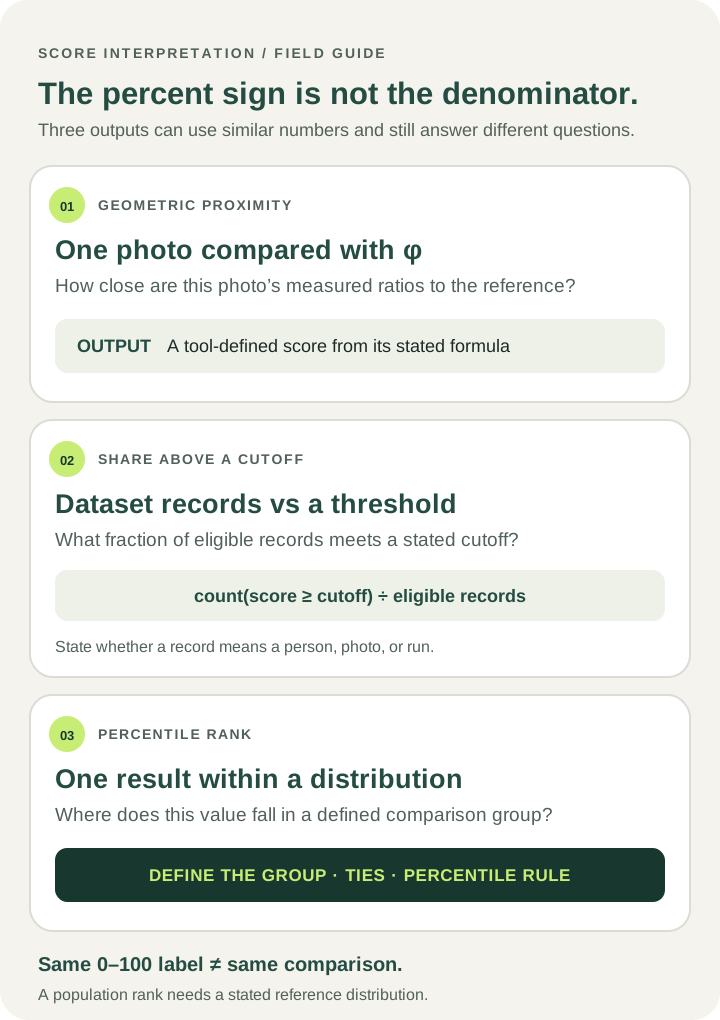
A tool maps one photo’s measured ratios to a reference and displays a score such as 80/100. The exact meaning depends on that tool’s formula.
“20% of results scored 90 or more” describes a portion of a dataset that crossed a stated cutoff. It does not tell you the rank of a new result unless the comparison procedure is also given.
A percentile places a result within a defined distribution. The reference group and the rule for ties or grouped scores affect how that rank is reported.
The National Institute of Standards and Technology defines the mean as the sum of included values divided by their count and the median as the middle value after sorting. A percentile is a separate summary of where values fall in a distribution. A mean alone does not show every value’s position.
02 / CHECK A COMPARISON CLAIM
Use this five-question score audit
Before trusting a result that compares your face with other people, look for these five items on the page or in its methodology. If an answer is missing, keep the claim unverified rather than filling in the blank.
Who is the reference group?Name the population the claim describes and how people entered the comparison set. A group of voluntary tool visitors is not automatically a representative sample of a country or of everyone.
What does one record count?Check whether a row represents one person, one photo, or one calculator run. If repeat attempts count more than once, the result distribution is about attempts unless the method adjusts for that.
Are the scores defined the same way?Look for the measured landmarks, target ratios, score formula, rounding, and version. A percentile from a different formula is not a direct rank for your score.
Can you see the distribution?A mean is one summary. A percentile needs the comparison values or a documented distribution, plus the rule used to place a score within it.
What limits the claim?Look for collection dates, sample size, recruitment and exclusions, uncertainty, and a clear statement of what the data cannot represent.
These are practical checks, not a certification standard. AAPOR’s disclosure standards similarly call for describing the population under study, how a sample was generated, when data were collected, how many responses were included, and the design’s limitations. Those details let readers judge how far a reported result can be generalized.
03 / READ THIS TOOL’S RESULT
What our score does—and does not—say
This calculator measures three visible facial proportions against φ (1.618) and combines their relative differences into a geometric proximity score. The score describes how the detected measurements in this photo compare with that reference under the formula shown on the calculator page.
It is not a percentile, a comparison with a database of people, or an attractiveness rating. The page does not display a population rank. A different camera angle, expression, lighting, or landmark placement can change the measured ratios, so use the guide to compare photo conditions and calculator methods before interpreting a changed reading.
Plain-language reading: “This photo’s measured ratios are this close to the chosen geometric reference.” It does not mean “this face is better than a stated share of people.”
04 / TRANSPARENT REPORTING
A template for a checkable percentile claim
If a tool publishes a people-based comparison, its report should make the denominator and method visible. This blank template contains no sample results; fill it only with documented data.
A report that cannot fill these fields may still describe its own output, but readers cannot independently check a “higher than X% of people” statement from a score or average alone.
A CLEAR NEXT STEP
Read the measurements before the headline score.
Inspect each ratio and its signed difference from φ. Treat the result as a geometric comparison from one image, not a verdict about appearance.
Open the golden ratio face calculatorQUICK ANSWERS
Frequently asked questions
Is an 80 out of 100 score the 80th percentile?
Not automatically. A score out of 100 can describe a tool’s proximity formula. The 80th percentile describes a position within a defined score distribution. The page must state which it means.
Can an average score show where I rank?
No. An average summarizes the included scores but does not reveal the full distribution or an individual result’s percentile.
What does “higher than 99% of users” require?
A defined comparison group, rules for people versus repeat attempts, a consistent score method, the score distribution, and a stated percentile calculation. Without these, the claim cannot be checked.
Does a high golden ratio face score mean a face is more attractive?
No. The score compares three geometric proportions with φ. It does not measure attractiveness or personal worth.